Last week1 Casey had a blog about High Speed Rail (HSR), and it triggered my worst impulse: my need to argue on the Internet. Casey suggested that I write my own post rather than just being cranky in his comments, and while my initial instinct was to continue to be cranky, I must admit that he was right and I should be more contstructive.
The starting point for all of this discussion is the continued boondoggle of trying to create a HSR between San Francisco and Los Angeles. Just to get this out of the way up front, there is no way in hell I would ever consider defending how this project is being implemented. I think HSR has a lot of opportunity in America, but the CA project is spending way too much2 for way too little compared to our peers. America needs to have a real serious “come to jesus” moment about why it’s so damned expensive to build important public goods. But how to fix that is beyond my capability.
At a very high level, Casey is making two broad statements about HSR. First, he’s making an argument about the capabilities of HSR in terms of efficiency, cost, maintenance, throughput, and other factual claims about HSR. Second he is comparing HSR against its alternatives, namely roads and airports, in argument that the alternatives are superior places to spend limited social resources. Obviously the first set of arguments is used to bolster the second set of arguments. There are some colorable arguments in this piece, but there are also a lot of serious factual errors that undermine the overall point. I think once you replace all the factual errors, the net sum of evidence points to the exact opposite of what Casey argues.
The clearest and least verbose3 way to approach this is to group Casey’s arguments into similar sections, so that I can provide counter arguments once rather than repeatedly. Therefore the pull quotes will not be in order from his post. Where reasonable, I will link to specific sources, with some exceptions for wikipedia when the source is obvious and I can’t be bothered. I pulled a lot of the numbers for European HSR from the 2009 paper Economic Analysis of High Speed Rail in Europe, and I will reference it repeatedly.
And finally, a few notes on methodology. I’m going to do my level best to avoid letting Covid goose the numbers. Covid crushed transit numbers and budgets across the board and required direct federal bailouts for all kinds of industries. There was no way for any of these companies to avoid a bailout during a once in a century pandemic, so it’s not fair to judge them by extraordinary circumstances. Where possible I will either use 2019 numbers, or 2021 if they’ve rebounded to pre-pandemic levels. I will similarly be using 2020 inflation4 numbers, because the inflation in 2021 and 2022 was caused to a large degree by supply chain constraints. Exactly what percent is debatable, but I don’t think that they tell us much about how construction costs might change.
High Level Misconceptions
“Why high speed rail hasn’t caught on”
The first and most obvious issue is the article’s title. I normally give blog authors a lot of leeway for clickbait titles, because I am not at all above reproach in this area. That being said the rest of the article is relatively consistent with the headline, so lets be charitable and assume that the title is indicating that HSR adoption remains minimal due to fundamental issues with HSR.
This … doesn’t seem very true? The list of famous HSR lines is small, most people probably can only name the “Japanese bullet train” or maybe TGV if they’re a francophile, but there’s a pretty decent list of HSR lines in operation that are unknown to foreigners. Until this article put a bee in my metaphorical bonnet, I had never heard of things like the Honam HSR Line, the HSR Madrid–Barcelona, the Banqiao–Zuoying line, or the Ankara–Konya high-speed railway to pick some random examples. And why should I? The goal of any train line ought to move people, not impress random jerks like me. The fact that a lot of these are obscure to non-locals seems like a mildly positive thing, I want HSR to be unremarkable and effective, not world famous. Boring infrastructure is reliable infrastructure.
Also, the list of countries with HSR is bigger than Casey implies. The size of this list creates problems for Casey’s main argument that he does not acknowledge. If the list of countries was small and similar in nature, we could potentially find mitigating circumstances to explain why HSR works in country X and not anywhere else, but that’s not the case. One might be inclined to say “China has HSR because a communist country can ignore profit and make money losing public goods5”, but this seems to lack explanatory power for Germany and the UK. One might argue that rich countries like Germany and the UK can afford luxury goods because they are rich post-industrial powers, but then again Vietnam and Kazakhstan are planning HSR, and Japan built a lot of HSR when it was emphatically not rich and post-industrial. Perhaps the flat terrain of France and the temperate climate of Spain is why, but then again you have Japan right there, all full of mountains and seismically active as can be.
Ultimately one is left struggling to explain why so many countries are doing what Casey argues they ought not be doing. All I see left is the argument that a dozen countries with wildly dissimilar economics, cultural histories, and geographic challenges are all being irrational in exactly the same way, which seems to run afoul of Occam’s Razor.
What Is HSR?
First off, what do even mean by “High Speed Rail”? Obviously speed seems to be part of it, so we’ll need to decide how fast a train has to be going in order to be considered “high speed”. Casey seems to draw the line at 300kph here:
Despite decades of development, only a handful of routes in Europe operate at anything like airplane-competitive speeds, which for all but the shortest routes, require > 300 km/h or > 185 mph.
and here
In general, the number of >300 km/h HSR networks on Earth can be counted on one hand,
While 300kph is certainly “high speed” this is actually a pretty idiosyncratic definition of HSR. The EU defines HSR (“Category I”6) as rails that can hit at least 250kph on purpose built lines and 200kph on upgraded pre-existing lines. Demiridis & Pyrgidis define HSR as having a maximum speed of exceeding 200kph and averaging over 150kph for the corridor that is being evaluated7. These numbers are selected because these are the points where the rail precision requirements, air resistance, and pressure issues in tunnels begin to increase rapidly. Above 200kph track side signaling is no longer workable, and Positive Train Control or something equivalent becomes mandatory. Personally I think that setting the bar at 300kph and declaring HSR a failure because this is a small set of rails does not seem terribly charitable8.
But lost in all this is the following question: why does defining HSR even matter to us? Personally I think that arguing about whether or not trains over 300kph are good or bad is putting the cart before the horse so to speak. In my opinion the goal should be to move the maximum number of people comfortably via rail for all of the reasons that even Casey acknowledges. Trains capable of exceeding 300kph and running on dedicated track is one of many tools available for achieving that goal. There will be times and places where dedicated track exceeding 300kph will be necessary for service to be competitive with alternatives. There will also be times and places where that speed is unnecessary or impossible. “The list of places that are a good fit for 300kph or faster rail service is small and mostly built out” seems like it might be stronger, but that’s not the argument Casey is making.
HSR Networks and Convenience
Right off the gate, Casey says a number things that I think are misleading about the design of a rail transport network and how end users might interact with it.
Despite decades of development, only a handful of routes in Europe operate at anything like airplane-competitive speeds, which for all but the shortest routes, require > 300 km/h or > 185 mph.
The oft-stated goal time of 2 hours and 40 minutes [between Los Angeles and San Francisco] is both unachievably rapid with finite money and current technology, and also too slow to compete with aircraft
HSR is not a compelling option for generic high speed intercity transport.
First of all, this drastically misstates end users revealed transit preferences. HSR does not need to match airline speeds in order to be competitive with airlines, because end consumers do not actually care about travel speed. Consumers care about door to door travel time, frequency, comfort, and cost. While airplanes do cruise at a much higher speed than HSR, they also spend a lot of time not at cruising speed. All the time spent getting to the airport9, through security, finding the gate, boarding, taxiing, climbing to cruising altitude/speed, landing, getting baggage, and travelling from the airport count10. Plus you have to include the indignities and discomfort of being shoved into a small seat and breathing bad air. The overall outcome is that while not everyone in Europe takes HSR, the general revealed preferences is that users take the train for shorter trips, with the break even point between HSR and flights for a given route at about 4.5 hours of train time.
Secondarily, the fact that HSR is a “tiny and static” portion of total rail network build outs does not reflect a fundamental flaw in HSR if it were true (but it’s not true…). HSR is not necessarily a good fit for every single country and city, it’s a tool that has to be evaluated in context. Lots of cities are too small or too close to justify HSR, and lots of countries have not been able to afford it. The list of cities that are a good demograhic fit for HSR in countries that can afford it has been a relatively stable set until recently, so it’s not that surprising that the networks haven’t grown.
Consider France. The TGV has 2800km worth of track directly connecting a pretty small number of cities directly. This might seem like a failure as an American, until you consider the demographics of France. France has a very different population distribution than America, with a huge percentage of the population living in or close to Paris. The Paris metropolitan area of Paris contains 14.6m of France’s 67.9 million people, or over a fifth of the countries population. So the TGV obviously connects all the cities you’ve heard of like Lyon, Nice, Marsailles, and Bordeaux, but also a bunch of tiny little towns that nobody outside the region has heard of. The TGV directly connects Avignon (pop 90,305), Arras (pop 40,830), Hazebrouck (pop 21,408) and Vendenheim (pop 5,971) to pick a few random ones. SNCF can and still is adding lines to improve the network, but they’re well into diminishing returns when it comes to what population of France they’re serving. In fact a lot of their planned lines actually leave France for Italy and Spain.
And finally, HSR is clearly not a compelling option for “generic” intercity transport, but that is an arbitrarily high bar to set. Very, very few people are recommending that we get rid of all airplanes for HSR. Instead people like me are instead arguing that HSR is a good fit for certain large population centers within certain distances of each other. There is no world in which people take HSR from LA to NYC, or LA to Montana. Instead the question is whether we should invest the money to create better or new HSR between major population centers in California and the Eastern seaboard.
Adoption
In general, the number of >300 km/h HSR networks on Earth can be counted on one hand, and the total track length is a minuscule and mostly static fraction of global rail network length, which itself is shrinking at a reasonably rapid pace.
I mean, this is literally false. The number of HSR networks with routes faster than 300kph is six, which is more fingers than I have on either of my hands. This list includes China, France, Japan, Morocco (!!), South Korea, and Spain. If we widen our list to include routes that are exactly 300kph, this list expands to 14 including Germany, Italy, the UK, Turkey, Saudi Arabia, Taiwan, Belgium, and the Netherlands. Meeting the EU’s definition brings in South Korea, Germany, Italy, Russia, Uzbekistan, Austria, and Switzerland for a total of 21. America just falls off this list with a top speed of 240kph11
The size of the network is also growing. China alone has added 40,000km of HSR to its network, so I would not call the track length “mostly static”. Morocco is also new, having added 323 km in the past four years. Networks under construction (not just in planning) expands the list to Canada, USA, India, Thailand, and Indonesia. This list excludes countries that already have HSR and are expanding their network, such as Japan’s under construction 286km 505kph12 Chūō Shinkansen line. So not only is the network bigger than “one hand”, but it is emphatically growing.
And this is to be expected! A lot of countries have not historically had the economy, the technical base, and the urbanization to make it worth it. While my general position is that HSR is not expensive compared to the large, rich econonomies of the global North, there are a lot of countries that cannot afford it. As countries like Vietnam and India get richer, it is not surprising to see them begin planning or constructing large HSR networks that they might not have been able to afford a decade or two ago. Vietnam in particular is currently planning a $58B, 1,545km HSR network. Vietnam also went from a nominal GDP of $34B in 1997 to an expected GDP of $408B this year. The fact that they didn’t have HSR last century and they’re planning it now is indicative of nothing more than their economy.
Global Warming and Transit
CO2
Alternatively, synthetic aviation fuel is under development to make aircraft carbon neutral. Indeed, at Terraform Industries we think synthetic fuel will ultimately be even cheaper than current options, expanding access to the convenience, speed, and safety of air travel.
First off, big conflict of interest here. Casey is a co-founder of Terraform Industries, so he is not a neutral party in this discussion, and he should have disclosed that. Given that Casey seems to believe that his company may be able to sell synthetic jet fuel, America shifting some of its transit from airplanes to HSR would have a negative impact on his company’s potential future profits.
But even if synthetic jet fuel is cheaper than refined kerosene, and I genuinely doubt it ever will be, this will not be enough to make jet travel “green”. The exact numbers vary depending on whose model you trust, but a huge chunk of the warming effect from commercial aviation comes from gasses other than CO2. Various mixes of particulate matter, black carbon, nitrous oxides, and sulfer compounds from the fuel interact in the upper atmosphere in an insanely complicated to model way, and tend to have a cumulative warming effect. There is also a big difference in spreading CO2 at sea level vs. high up in the atmosphere, even if it’s previously captured CO2 rather than new from the ground.
But the worst offender by far is water vapor. The contrails left visibly behind jets is created by water in the exhaust gases condensing in the atmosphere. While these gases are short lived, they do have a large warming effect for their lifetime. Per the EESI: “The effect is so large today that it exceeds the total warming influence of all the CO2 emitted by aircraft since the beginning of powered flight.” Synthetic fuels will do nothing to solve this. Water is an unavoidable by product of the hydrocarbon combustion process, and Terraform Laboratories making synthetic methane1314 probably reduces the warming effect of air travel by less than half. As we’ll see, HSR generally reduces the energy consumption per passenger km by a factor of 3 or more15. And that’s before you consider the fact that it’s using electricity, which can be powered by a variety of sources.
Concrete
HSR grades cannot be built between nearly any city pair on Earth without moving a LOT of dirt and rock and pouring a LOT of (CO2-emitting) concrete
What, and airports don’t have a lot of concrete too? JFK airport has four runways totaling 44,900 feet in length, all are 200 feet wide and 18 inches thick for a total volume of 13,470,000 cubic feet. The Shinkansen trains seem to use the most concrete for HSR because they use slabs of concrete rather than concrete “sleepers” like in other countries. These slabs are 2200mm wide, 4900mm long, and 190mm thick. This gives us a total volume of 418 cubic meters per kilometer of track16, or 14761.5 cubic feet per kilometer. So just the runway at JFK contains enough concrete to make 912km of Shinkansen, or about 1/3rd of the system’s length. And that’s before we consider the taxiway, terminal, parking lots at the terminal, maintenance facilities, etc.
And yes, stations also contain concrete, but train stations are much smaller than airports. The Atlanta airport terminal covers 130 acres, or 0.52 square kilometers. Tokyo station is 0.182 square kilometers in size. Oh and Tokyo station moves 500,000 people a day to Atlanta’s 300,000. There’s also random bridges and viaducts and what not, but there’s really no way to slice this so that HSR is using more concrete than its alternatives17:
Frequency and Scale
But rail has relatively narrow limits in terms of train size and frequency meaning that any route will be both congested at peak times and under-utilized for much of the rest.
The statement about size and frequency is really not true. HSR shows a huge variation in train size both internationally and within the same system, often significantly more variation than a lot of airlines. Furthermore train frequency is also much more variable than is implied here.
First a note on sizing. Both airplanes and trains can be configured to make tradeoffs between seating capacity and seating price. This often says less about the fundamental capacities of the transport, and more about the market segment the operator fits in. Therefore I’m going to try and represent the maximum ranges for models in use, to be fair. Exceptions will be made if configurations are available but are not purchased in practice.
I am also going to disregard historical vehicles. There is a lot of cool stuff that is no longer in use, like the Concorde, but they tell us nothing about vehicle tradeoffs today and going forward.
Aircraft Size
Lets start with aircraft size. I am going to explicitly exclude private airplanes, which typically seat few people and don’t really fit in a discussion of mass transport. This includes Cessna type general aviation craft, and private chartered jets like the Leerjet.
The absolute smallest commercial craft are going to be turboprops used by regional and commuter lines. There tend to be a lot fewer of these than their low purchase price would imply, and they’re under a lot of pressure from narrow body jets, but they do exist so lets look at them.
- ATR 42
- Seats 48
- 232 in airline service
- ATR 72
- Seats 72
- 444 in service
- De Havilland Canada Dash 8 Q400
- 82-90 seats
- 508 in service
A step up from that are narrow body jets. These represent the bulk of commercial aviation both in terms of aircraft sales and passenger miles. This set includes the 737, which is basically eating up all of aviation now that it has the range to handle long range travel.
- A220
- 108-160 seats
- A300
- 228-361 seats
- A320
- 150-186 seats
- 737
- 85-215 seats
And lastly we have the wide body jets. These are less common thanks to improvements to narrow body jet ranges and fuel economies, but they definitely exist and are in operation.
- 747
- 467-605 seats
- 777
- 301-550 seats
- A380
- 555-853* seats
There’s an issue with that A380 number. As best as I can tell, nobody ever flew the A380 with the 853 seat configuration. The largest operator and the operator of the largest A380, Air Emirates, has a maximum seating of 615. Most operators of the A380 ran it with 400-500 odd passengers, presumably for economic reasons.
So that’s the range we’ve got, 48-615 seats if you include turboprops. Limiting yourself to jets you end up with 108 to 615 seats.
Train Size
Like airplanes HSR cars can be configured for a mix of seating types. Unlike HSR trains can be adjusted in length to change capacity with the same equipment. In practice most HSR routes purchase fixed trainsets with known capacities, but there is a trend towards more dynamically reconfigurable options, both in terms of train composition and train interiors. More on that in a moment.
HSR train sets tend to come in two large design categories. Some use dedicated power cars, usually two per train set, with unpowered carriages in between for passengers. These appear to generally be cheaper, but are limited to 9-10 carriages per train set. Almost all of the small HSR trains are of this configuration, including:
- Alstrom AGV
- 245-446 seats
- NTV rail line in Italy
- Acela Express Trainset
- 304 seats
- In use with Amtrak
- Renfe 100
- 329 seats
- In operation in Spain
- Renfe45 102
- 318 seats
- In operation in Spain
These are just the smallest train sets of this configuration I could find. Lots of trains of this design are significantly bigger, with the norm being 400-500 seats.
- KTX-Sancheon
- 363-410 seats
- In operation in South Korea
- TGV Réseau
- 377 seats
- In operation in France
- Euroduplex
- 509-533 seats
- France and Morocco
- TGV Duplex
- 508 seats18
- France, again
- TGV M
- 740 seats19
- No points for guessing that this is also French
- FS Class ETR 500
- 422-671 seats
- In operation in Spain
At this point we’re above the A380 in capacity, but we’re not done yet! There is another type of HSR railset, the Electrical Multiple Unit (EMU). EMU trains lack dedicated powered cars, and instead have some or all of the passenger compartments powering the train. These come at higher per-train cost, but can be configured to nearly arbitrary sizes, and can move an absurd number of people. EMU trainsets seem to vary anywhere from 8 to 20 cars. Different lengths on the same line to adjust capacity seem to be pretty common, with the Shinkansen preferring 8 and 16 car configuration. Some examples.
- 700 Series “E” configuration
- 8 cars
- 571 seats
- San’yō Shinkansen and Hakata Minami Lines
- CRH3
- 8-16 cars
- 551-1053 seats
- In operation in China
- Fuxing
- 8, 16, or 17 cars
- 575-1283 seats
- In operation in China
- N700A “K” configuration
- 16 cars
- 1,260 seats
- In operation in Japan
- N700S-3000
- 16 cars
- 1,323 seats!!
- In operation in Japan
So that is our range for HSR, anywhere between 245 seats to 1,323 seats. Not exactly a relatively “narrow” limit, I would say. I’ll certainly grant that airplanes give more flexibility at the low end of the spectrum with things like turboprops and very small narrow body jets like the A220 not having a direct HSR equivalent. But at the top end HSR wins the size comparison handily, plus it gives operators the ability to reconfigure train size quickly and cheaply if need be. There is no air equivalent to putting another carriage on the TGV M, or mixing and matching cars to make a TGV Duplex, or doubling the size of a CRH3.
Frequency
Okay, but are airplanes more frequent? Let’s see!
Before we start, let’s set the ground rules for comparison. First, frequency is largely driven by demand, so low frequency routes tell us very little about the system could do. The flight route between nowhere and east armpit doesn’t really have a lot of demand, so it doesn’t tell us what the flight route between LAX and SFO could theoretically handle. Second, we want to be very careful when comparing system wide stats to individual routes. At any given point there are more HSR trains in operation than there are flights between two arbitrary cities, but that infrastructure demand is spread out, and does not tell us what the throughput between two given cities could be. More simply put, frequency is driven by demand but limited by infrastructure.
Airplanes
The first limiting factor for airplane frequency is that they can have a very long turnaround time, which is the amount of time it takes to swap one set of passengers for the next and prepare the plane for flight. The larger the plane, the worse this gets due to the ratio of passengers to exits. So for your very large aircraft like an A380, your turnaround time is 90-110 minutes, or nearly two hours worth of time not traveling. Smaller aircraft do this better. Southwest used to be able to do a 10 minute turnaround with their 737-200s back in 1977, but these only seated 130 people max. Now that Southwest runs 175 seat 737 Max 8’s, their average turnaround seems to be about 35 minutes pre-pandemic. During the pandemic that expanded to 50 minutes due to the time required to clean surfaces. Rounding the math a bit, a 30 minute dwell time for a one hour route puts the maximum frequency of 8 round trips per day per plane. The 90 minute turnaround time for an A380 only allows for a bit under 5 round trips per day per plane.
The obvious solution here is to buy more than one plane. Airlines make money on all but the smallest routes (which are often subsidized), so assuming there is customer demand it’s pretty easy to justify buying another plane. Assuming that you can get a crew for it (there is a pilot shortage at the moment), two 737s would allow Southwest to run 16 round trips a day, and three would get you 24. Continuing to assume that we can lease enough planes and hire enough pilots, what’s our limiting factor?
Turns out that gates are our limiting factor. We’re all familiar with specific airlines being in specific terminals (Southwest is in terminal 1 at LAX), but most people don’t know that airlines lease individual gates from the airline too. Currently Southwest has 13 gates at LAX, so let’s start with that as our number. 13 gates means that we can have no more than 13 planes currently turning over in parallel; any more and our turnaround time will increase and our frequency will not change. Sticking with our generous 30 minute turnaround time, this means that a new plane can arrive every 30/13 or every 2.3 minutes. At this frequency, with no mistakes, every time a plane leaves to take off, another will be arriving to take its spot. This frequency gets us 626 round trips per day from 13 gates with a 30 minute turnover time with no variation or mistakes.
But wait! Capacity at the other side matters too! SouthWest shares one gate with JetBlue and has five all to itself at SFO. This means our capacity on the SFO side is about 5 gates, depending on how JetBlue and SouthWest split gate B8. This drops our frequency for LAX<->SFO down to 30/5, or every six minutes for a total of 240 a day.
But there are still issues! Those gates are not intended to serve just one route they’re intended to serve all routes. If we use that to run one route at maximum frequency, Southwest will not be able to fly anywhere else from SFO. Southwest in fact flies to 7 different cities direct from SFO. Even assuming that the route route is twice as important as the rest (I made this number up) we get a much smaller 60 flights per day. But still, we do have a workable formula here: the maximum flights possible for an airline at an airport is (turnover time)/(min(gates at airport a, gates at airport b)).
We’re not being terribly fair to airplanes here though. The number of users who will refuse to fly to any given city if it’s not on their favorite airline is small, most users will price shop. Rather than doing more math, I think the best way to actually figure this out is to look at real world route numbers. This should give us an idea of what the high water mark is across all cariers in an airport. So, what is the busiest route that actually exists in the world?
The busiest in terms of both passenger count and plane trips is Jeju South Korea (CJU) to Seoul (GMP). Between January and November this route totaled 71,38820 trips, and it totaled 17,082,700 passegners for all of 2021. This time frame gives us 334 days, and an average of 213 flights per day. Presumably this number varies a lot on a day to day basis, given that Jeju is a tourist destination. After this route the numbers fall off dramatically, with the next most populous route being Seoul to Busan South Korea, with 28,809 flights between January and November of 2021, or 86 a day averaged. LAX to SFO ran 15,828, or a mere 47 a day averaged. While a few routes are extremely busy, most routes do not actually see that many planes per day.
HSR
HSR frequency is actually pretty tricky to figure out, because it depends heavily on track design. Trains do not accelerate and decelerate quickly, so all trains must keep a minimum safe distance between each other measured in minutes. Simplistically this puts an absolute ceiling on the frequency that trains can travel. For the Shinkansen the minimum safe headway is 3 minutes21, giving you a maximum frequency of 60/3=20 per hour.
There is also the concept of dwell time, which is the amount of time that the train spends at the station waiting for passengers. Dwell times for trains are much smaller than turnover for planes due to a much higher door/passenger ratio, but they are not instant. They are also partially decided by cultural factors about how compliant people are in queueing and boarding. For the Shinkansen system the average dwell time is 3 minutes, and 5 at the airport for baggage. The TGV tends to be 5 minutes. Lets be pessimistic and assume 5 minute dwell times. Assuming simplistic signaling, all trains must be minimum headway + dwell time apart to ensure that following trains have enough headway while the preceding train finishes its transfer, which gives us 8 minutes for the Shinkansen. More intelligent signaling ought to be able to reduce the headway as trains decelerate, since a slower train stops faster, that way each train does not need to maintain a full 3 minutes headway as its decelerating. So our minimum spacing in this case drops to either the maximum dwell time among the stations, or the minimum safe headway, whichever is lesser. For most HSR routes it’s going to be the dwell time, since 5 minute dwell times seem to be pretty normal for stations connecting to (ironically) airports.
Of course this assumes that each station has only one platform and every train stops at every station, which is a very bad assumption to make. To stick with the Tokaido Shinkansen we see that they run three named services on the line with sixteen stations. Only one service, the Kodama, stops at every stop. The Nozomi only stops at six stations on the route, and the Hikari changes what stations it stops at depending on the time of day. Having different trains stop at different stations lets the operators bypass slow stations for express routes, and move more trains than the station design might otherwise allow. Shinkansen stations are also universally multi-platform, which will allow trains to travel closer together than their dwell time, and overlap slightly in the station. The only station on this route that only serves the Shinkansen is Shin-Fuji station, and it has two platforms. The rest have more platforms to both service the Shinkansen and various other commuter rails. Excepting the mega stations near the end of the line, the median station on this line seems to have six platforms, and most serve not just HSR but local commuter rail as well.
Okay, enough theoretical talk, what is the actual observed frequency of HSR? It varies. European HSR seems to run at relatively low frequencies, such as the Eurostar Paris->London route with 12-14 daily trips, and the Paris->Lille service offers 18 daily trips. German ICE trains tend to have hourly or every other hour service. Chinese HSR varies from 1 a day (Beijing–Suzhou) to 238 a day (Huning PDL), with the dedicated HSR lines seeing much more frequent and rapid use. None of their dedicated linesn sees fewer than 12.
The real high water mark for HSR is again the Tokaido Shinkansen, which operates 365 daily trips, peaking at 16 per direction per hour. This combined with the largest trains is certainly why their ridership is the highest.
Takeaways
As is expected, there is a lot of variation. But on the whole HSR shows higher capacity, and the possibility of higher frequency operation than all but maybe one or two air routes. Even moderately sized HSR trains like the Euroduplex exceed all but the largest aircraft, while many EMU trains more than double the seating capacity of any aircraft for sale today.
Frequency tends to vary a lot as well. Most HSR and air route do not see a lot of trips, but the heavily used routes see a lot of daily trips, more than all but one or two air routes. The Tokaido Shinkansen moved 452,000 people per day back in 2016. The busiest air route in 2021 moved 17 million people for the entire year, which one line on the Shinkansen exceeded in 38 days. The busiest route in America, NYC to LAX is equivalent to less than 9 days of Tokaido Shinkansen, SFO to LAX is 8 (2018 numbers for both air routes). And we’re handicaping the Shinkansen by using 2016 numbers for it and later dates for the air routes. HSR can move an unbelievable amount of people if the will is there.
Why am I focusing on this so much? Because Casey seems to have a drastic misunderstanding of the capabilities of HSR. He had this comment in the follow up discussion from his article.
HSR headway requirements mean they move not that many people either. 740 people per train is great, but how many trains move per hour? Even Japan I think does maybe 70 trains per day on the busiest routes, or <3/hour.
There is literally no part of this sentence that is true! All the numerical claims are not just wrong, they are all a digit short of the correct answer. I get that this is a blog written for free “in about an hour between putting the kids to bed and collapsing from exhaustion”22, but these numbers were not hard at all for me to verify. I think the argument that most HSR does not have the same scale as airlines is probably true, but Casey said that they “can’t”, and that is clearly false.
Rail is Outdated?
Even in 2022, freight by rail is much slower as rail cars must wait in yards for trains to be assembled.
I’m going to keep this discussion brief, because going into freight rail is going to make this long post longer. The issues listed here are actually an issue with American rail specifically, and how it’s organized. It is not endemic to all rail systems. Basically in the 1970s American freight rail operators made the decision to make trains longer and less frequent. This has reduced labor costs for the railways, but has resulted in more derailments, more traffic jams, inconsistent schedules, and low quality of life for rail workers. Not every nation has gone down this path, with countries like Switzerland producing freight systems that has drastically reduce the amount of trucking in the country. The result is that US freight rails are largely bulk, time insensitive goods (grain, aggregate, coal, etc.), a larger percentage of European freight rail is individual wagon loads destined for smaller enterprises, rather large unit trains for massive consumers like power plants. For more, check out Justin Roczniak’s recent NYTimes piece or the episode on battery electric trains.
von Kármán–Gabrielli Diagram
I’m going to break out an entire section to talk about von Kármán–Gabrielli diagrams, because this matters. See the image from Casey’s blog below.
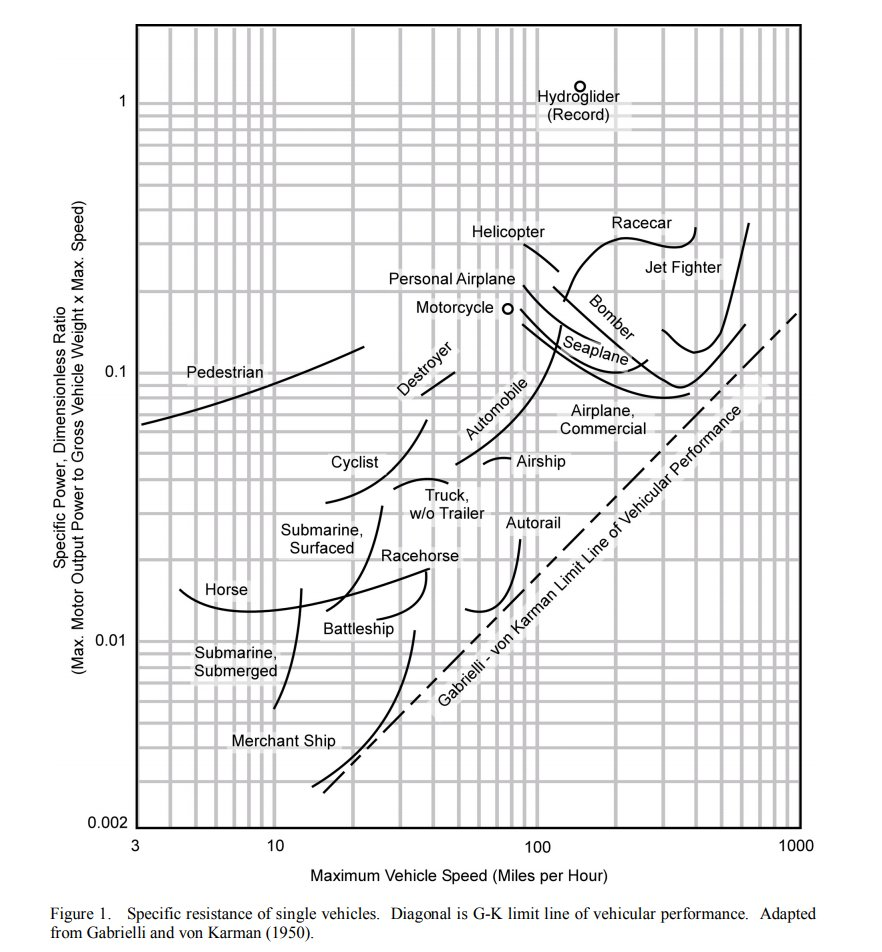
First, lets explain this chart. This chart is designed to represent how efficient an entire mode of transportation can be in a way that is trivially comparable. This is necessary (and brilliant!) because it can be somewhat hard to compare the efficiency of different modes of transport using more naive methods.
On the X axis we have speed in miles per hour. This exists because every mode of transport has both a minimum and maximum reasonable speed, nothing in the world is going to make a horse go 100mph for example, and efficiency changes over those speeds in different ways for different modes of transport.
The Y axis is a unitless efficiency rating, which is not quite the same as efficiency as you or I might be used to. The goal is to compare modes of transport, not just individual vehicles. The unit is energy used / (vehicle mass x velocity). This efficiency lets us both compare across vehicle types, but also eliminates rather simple forms of analysis. If you throw a ton of bricks in the back of your truck and your fuel economy goes down, it has not necessarily gotten less efficient as a means of transport, you’re just asking it to do more. Making your vehicle out of light weight composites will likewise improve energy consumption, but will not drastically change the line on this graph. But if you replace a steam train with an electric one, then we’d expect the number to change. Put more sincinctly this graph responds to large jumps in efficiency, not incremental ones.
Two other things. First there is a marked “limit line” on the graph. This isn’t some iron-clad rule of the universe, it’s just the apparent limitation of technology at the time. Second both axis are logarithmic, so straight lines are deceiving.
Here’s Casey’s argument with this graph.
The zeroth order truth of the vK-G diagram is that there is a limit line of vehicular performance, which is essentially determined by momentum transfer limitations for vehicles that have to displace water or air to move along. It does not apply to spacecraft!
The first order truth is that, above 100 mph, the most efficient transport mechanism shifts from ground-based to air-based. For smaller creatures than humans, the transition speed is a lot lower – most insects fly instead of walk.
And if you look at the graph you can indeed see his point. The “autorail” line is both further to the left of airplanes, and the line is sloping up quickly. This if we extrapolate from the train line, it’s pretty clear that at a minimum it is going to be much less efficient than an airplane at around 300mph, which is where airplanes are the most efficient.
But, wait a second, something weird is happening here. This clearly shows trains topping out at 100 miles per hour, but plenty of train lines hit 200 miles per hour. And it shows airplanes being the most efficient at 300mph and maxing out at 400mph, when the cruising speed for a 737 is about 515mph. And what the hell is “autorail”? Something is up. So, let’s be good investigators and check the citation, rather than just the graph.

Oh… Oh no. This graph is from 1950. While the methodology is still sound, I do not think that the actual numbers hold true 72 years later. At a minimum these numbers represent propeller driven aircraft, and potentially steam trains23. We cannot draw any meaningful lessons about today’s technology using this.
So, here’s an updated graph! It’s from 2004, and while that’s also oldish, at least vehicles manufactured in 2004 are still in regular use today.24
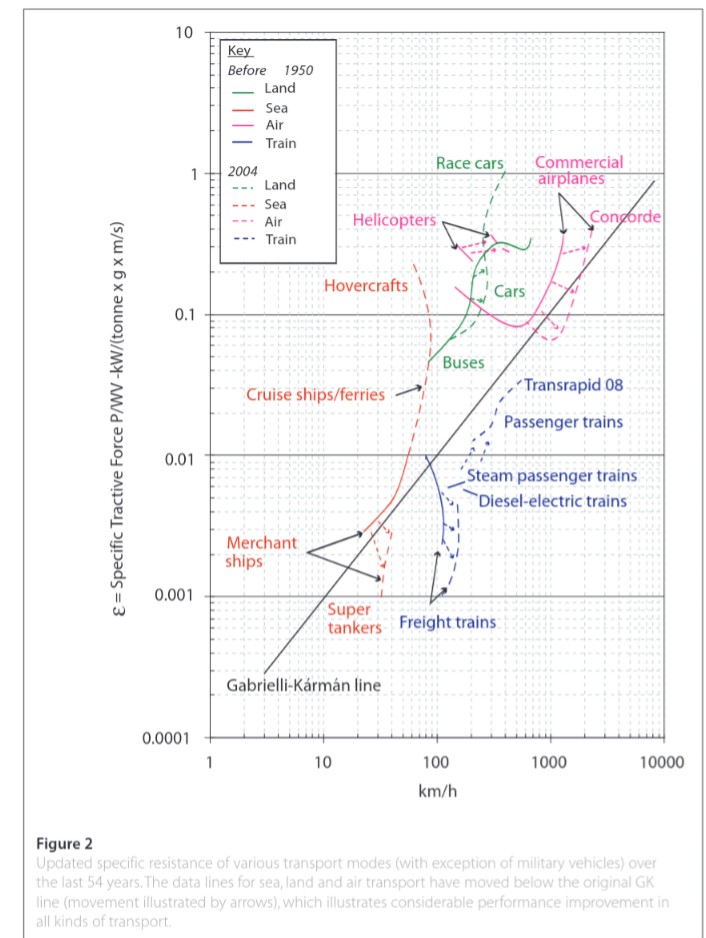
This graph is a tiny bit harder to read, because the authors added a few new features. First, each vehicle now has two lines, one for 1950 and one for 2004. Solid lines are old, dashed lines are updated. This lets us see how things have changed. Second, the creator of this chart has added specific vehicles to the lines, so for example Concorde is pointed out specifically. These represent the far edge of what a given mode of transport can do.
First thing you’ll notice is that super tankers and passenger rail is now below the line. We’ve clearly pushed the limits of technology since 1950, which is good and expected. The second thing you’ll notice is that the curve for passenger rail is now clearly below that of airplanes. Casey’s assertion that “above X mph the most efficient form of transport shifts to air” is at least no longer obviously true, and may in fact be false.
This holds up when we consider the real world numbers from the Economic Analysis book, which lists the following figures for MJ per passenger km:
- Gasoline car on highway: 0.4725
- This assumes 5 passengers. so 2.35 for single occupancy
- Diesel car on highway: 0.34
- Same as gasoline car. 1.7 for single occupancy
- Passenger aircraft for 500km flight: 1.826
- Intercity rail: 0.22
- HSR: 0.53
I will admit, I got more than a tiny bit snarky in the comments about this on Casey’s blog. We all make mistakes, I’m sure I’ve made some here, but this one is pretty glaring. That being said it’s the response to the error that really sits poorly with me, as Casey’s eventual response is that the blog is free27 and he owes me nothing. Obviously my own snark contributed to that interaction, but I think he owes his readers more intellectual rigor than this. My assertion is not that he owes me specifically an apology, but rather I think that he owes his readers in general some level of intellectual rigor and honesty.
Also very interesting is that “transrapid 08” mark, which is a maglev train. Most people know that maglev trains are really, really fast, but I don’t think people realize how efficient they are too. To be fair, a lot of the concerns about the cost of building HSR absolutely apply to maglev trains. The only existing one cost a pretty absurd $1.33B for only 19 miles of track. But it can also go 431kph, and is several times more efficient than an equivalent plane. They can also apparently handle steeper gradients, which is very interesting. They might be a game changer, or they might be a dead end due to construction costs, it’s too early to say28.
Funny Accounting
It’s time that we talk about the money.
Airport Time!
If I build another airport, I have added 15,000 potential connections to the network. If I build another rail terminal and branch line, at significantly greater cost than an airstrip, I have added only one additional connection to the network.
This quote is expressing two distinct ideas.
- Creating an airport enables more types of travel than HSR
- HSR is much more expensive than an airport.
I think there is a defensible argument in here! It is obviously true that creating an airport enables types of travel that HSR cannot, especially in a country the size of America. I am certainly not going to argue that my city does not need an airport, as there is no reasonable world where that airport can be replaced with HSR to where I want to go.
But, I disagree with the sentiment expressed in the quote in some very specific ways.
- It is drastically overstating network effects of airports. Adding a new airport does not come anywhere close to 15,000 connections
- It implies that HSR and air is an either or proposition
- It drastically understates the cost of air travel infrastructure.
Hey, how many airports are there anyways?
Really, 15,000 airports? That feels wrong. I’ve moved around and travelled a decent bit, and I can only name 21 I’ve been to in the United States, which is a measly 0.14%. Is it true that building a new airport gives you access to 15,000 19,00029 airports?
Well, no. The vast majority of these are “general aviation” (GA) airports that largely serve private pilots. This is really sweet if you’re one of the 160k30 Americans who have a private pilots license31 and can afford to own32 one of the roughly 210,000 GA aircraft registered in the US, but this is not relevant to the vast majority of the population. Technically these airports can offer non-scheduled private flights, known as chartered or air taxi service, but this is such a miniscule33 percentage of US flight miles, we can effectively ignore it. To the vast majority of the American population, these general aviation airports provide no utility in transporting them around the country.
Okay, so how many airports can you buy scheduled service to? According to the ASCE, 520. These are further categorized into large, medium, small, and reliever hubs. Here are the counts:
- Large
- Count for at least 1% of US enplanements
- There are 30 of them
- Medium
- 0.25-1% of total enplanements
- I could find 31
- Small
- 0.05-0.25% of US enplanements
- I could find 71
- Nonhub
- < 0.05%
- 264
- Reliever
- Only exists to relieve congestion at a larger airport.
- I could not be bothered to actually count these, but if the ACSE is right then the answer is 124.
Realistically, the vast majority of air traffic is going to go through large, medium, and small airports, which is a pretty small set. We’ve now droped from 15,000 originally down to 13234. So constructing a new airport theoretically gives you access to not 15,000 airports, but 132 airports for scheduled flights. That is far less impressive, but to be fair a lot of these 132 will be in large population centers where lots of people want to fly to.
For funsies I was able to find 223 stations served by TGV, including international ones like London-St Pancras. So there are more TGV stations than there are large airports in the US, which is interesting. By the numbers, building a new TGV station gives you access to more cities inside France than building a new airport gives you access to airports in America. But, to be fair more American Airports are going to be outside that magic 4.5 hour limit.
Network Effects
The thing we’re obliquely talking about in the previous section is the network effect. The network effect is the process by which certain types of systems become more valuable the bigger they are in a non linear fashion. This process doesn’t just apply to transit35, but we’ll focus on transit here.
Imagine that the world has no airports, and you make the very first one at city A. This airport is basically a novelty, you can take off from it, but there is nowhere else to go; you can fly around a bit, but you’re forced to land back at A again. Our total number of routes is 0. Building the second airport at city B increases the number of routes to 1; people in A can go to B and vice versa, so one new airport added one route. A third airport at C adds two more routes to our network even though it only added one extra place you can go to from A or B. Our routes now include A-B, A-C, and B-C. Adding a fourth airport adds three more routes, and so on and so forth. The size of the network is basically (N-1)!36. This is an exponential process, and is what Casey is talking about when he says that adding a new airport gives you more options than a new train route.
Of course, this is not actually how airports work. Not every airport has a connection to every other airport, there is and never will be enough infrastructure to handle that layout. Instead most airports connect to the destination through a regional hub. So my airport (Boise) only offers direct flights to a handful of major cities, and mostly close ones at that37. I can’t even fly direct to NYC from where I live. If I want to travel to anywhere not on this short list, I have to fly to one on the list and transfer. So trips to NYC almost certainly require a layover in Denver, Atlanta, or Chicago. This drives up travel time far above what the straight line speed of an aircraft would imply, and certainly is a drag on customer usage.
But wait, it gets worse! All of this only applies to airports that are big enough and expensive enough to attract even a small number of airlines. Even among airports offering scheduled service, this is not the majority. If I lived over in Twin Falls, my flight options look a lot worse. Twin Falls airport offers scheduled service and is classified as a “nonhub” airport, but it only offers direct scheduled flights to Salt Lake City. A flight to Boise from Twin Falls involves a layover in Salt Lake City, plus $600 or more. All this for a 128 mile trip which could be served well by basic intercity rail38. Instead we count on cars, which is both expensive (more on that in a second), has a lot of externalities39.
When researching this article, I ended up considering the case of Youngstown OH. Youngstown has a regional airport, but that airport lost its last scheduled flight provider in 2018, meaning that everyone in the region now has to drive about an hour to CLE for flights. The frustrating thing is that Youngstown is precisely the kind of place that would be served by HSR (or a quick interurban connection to HSR) in Europe because it lies between major population centers that can support HSR traffic. In fact the Capitol Limited40 used to do exactly that! Our disinvestment in rail and preference for air travel has left places like Youngstown very vulnerable to positive feedback loops where loss of population and industry makes the airport less profitable, losing flights and routes which hinders economic recovery. I suspect that upgrading the Capitol Limited to even Category II EU standards might be worth it, but that will have to wait for another post; this one is far too long already.
Rail networks are much more complicated to model. It depends on the layout of the existing rail, and how new lines are added. Keeping in mind that 4.5 hour figure from above, it is not hard to see how adding a branch line from a LA->SF HSR to Sacramento would allow people in all 3 cities to reach each other. As a general rule adding a new station enables access between the new branch and anywhere else in the network that is 4.5 hours away, which can often be significantly more than just “one additional connection”. This is particularly true when the new branch offers through service, which is common in a lot of interurban rail. Through service means that a train on one branch “changes” its name and continues operation on another route. This means customers can avoid transferring trains and travel through. This is not a panacea for network effects in general, but it does make the situation a lot rosier than Casey states.
Also, at the risk of being snarky, rail system designers are not dumb. The tradeoffs and usage patterns for HSR vs plane vs car are very well known at this point in time. Lines are added to connect as many people to as many points on the network as is reasonably possible, and to shorten as many trips as is possible. If a route will provide minimal value to the overall network, it just won’t get made.
Either Or Fallacies
I think the big fallacy Casey is making here is that he’s implying that we can have either an airport or a HSR. Obviously I think this is a mistake.
At first blush, this is a reasonable assumption to make. While we can haggle over how cheap we could possibly make a new HSR network, the practical floor for even a small set of routes through California is in the tens of billions. Airports are likewise expensive. It absolutely makes sense to avoid making two very large infrastructure decisions that seem to compete.
And yet, that is exactly what countries with HSR do. While it sounds dumb to say this explicitly, Paris has a big airport. It in fact has two airports, and it is the center of all of France’s HSR offerings. What gives?
It’s worth thinking about what happens to tranel between two cities with viable HSR. There are three possible things that can happen, and they are not mutually exclusive.
- Airline travel shifts over to HSR
- Non-airline travel shifts over to HSR, typically car trips
- HSR generates new trips
If airline traffic shifts to HSR, then we free up gates in the airport. This lets us either use those gates for routes that HSR cannot possibly handle, or it allows us to build a smaller airport41 or defer incredibly expensive airport expansion. Which you choose depends on what demand for non-HSR routes looks like, and what the costs of expansion might be.
Non-airline car traffic shifting over to HSR is an unambiguous public good. Driving is inefficient, polluting, dangerous, and expensive. Getting people to reduce car trips voluntarily because we’ve offered them something more convenient is a win-win. Less pollution, fewer car deaths, less traffic42, what’s not to love?
And finally HSR can generate new trips that did not exist before, increasing the total number of trips between the cities in question. This is your classic induced demand, except that it’s good for mass transit. Induced demand for roads is bad because roads do not scale well and traffic becomes an issue. Induced demand for trains is less of an issue because trains scale relatively gracefully. Relatively few HSR routes are capped out in terms of frequency and train size, so you can just run more trains43 if more people want to travel. This is extremely good. The purpose of mass transit is to move people around so that they can enjoy their lives and generate economic activity. If a shiny new HSR network makes more people do that, then it’s doing exactly what we wanted it to do.
Airports are cheap, right?
What about that “at significantly greater cost” bit? Is HSR more expensive than an airport?
Honestly, it’s not exactly clear to me. The tradeoffs in terms of up front cost is extremely complicated, and requires us run through some counterfactuals that are way beyond my ability. How much would LAX cost to construct and run if most of its California bound traffic got shifted to HSR? Hell if I know.
Instead I’m going to focus on the “significantly greater cost” half. Airports are, frankly, really fucking expensive in the US. But they are expensive in a way that is very hard for us to see. HSR tends to be either nationalized or run by a small number of highly visible companies whose budgets and subsidies are subject to easy visibility. Airports on the other hand are typically run by the city they’re part of, which makes tracking down the sum total of subsidies and construction costs beyond what I can research easily. Also there tend to be a lot of hidden subsidies, such as joint civil military44 bases. My local airport hosts a portion of the Idaho national guard. How much does this subsidize the airport? Dunno.
Less directly, there are schenanigans involved in the financing of airport maintenance and work. Salt Lake City rebuilt their terminal last year (2021) for $4.1B. All of the articls I read were very, very specific to say that no tax payer money would go towards the project, and this is kind of true. Financing for the project was done through bonds issued by the city itself and repayable from revenue from the airport and trust accounts45, and interest earned by investors is tax free both federally and at the state level for Utah residents. This provides the airport company a significantly lower cost of financing the project at the cost of lowered income taxes and leveraging the city’s better credit rating. This kind of bond structure is not unique to Utah or airports, but I think we should be absolutely clear that this is a subsidy structured to not look like one.
Anyways, airports need to be constructed new and reconstructed on a regular basis. Here are a few projects I found that were completed.
- Denver International Airport (1995)
- Budgeted: $2.8B
- Actual: $4.8B46
- Inflation adjusted: $8.5B
- Salt Lake City Airport Terminal (2021)
- Budgeted: $3.6B
- Actual: $4.1B
- Atlanta Airport Runway 10-28 (2006)
- $1.28B
Clearly building even a terminal is fairly expensive. Worse still these need pretty expensive rebuilds on a constant basis. Airport Technology’s project pipeline tracker lists 127 ongoing projects worth $155B total. Worse still, some of these projects are repeats, with recently rebuilt or expanded airports getting another pass of money. For example Denver International Airport is getting upgraded again to the tune of $2B, after the initial construction in 1995 went over budget by a factor of 2.
Here’s a list of project that stood out to me. All of these are in execution at time of writing, and I’ve included a few examples in countries with known HSR networks, for later comparison.
- John F. Kennedy International Airport Redevelopment ($15.5B)
- O’Hare International Airport Expansion ($9.8B)
- O’Hare International Airport Expansion II ($8.5B)47
- LaGuardia Airport Redevelopment ($8B)
- Hartsfield-Jackson International Airport Expansion ($6B)
- LAX Automated People Mover System ($4.5B)
- San Francisco International Airport Expansion ($4.1B)48
- Henoko Runway Development ($8.5B)49
- Frankfurt International Airport Expansion: Terminal III ($4B)
What about rail? The Economic Analysis of High Speed Rail in Europe lists that the cost of HSR as being between €9,000,000 and €39,000,000 per km (€10,412,035.44 to €45,118,820.23 in 2020), while maintenance varies between €12,919 and €71,650 (€14,945.90 to €82,891.37 in 2020) for European HSR projects. Do these numbers hold up in the decade since publication? What about for Japan?
- Perpignan–Barcelona high-speed rail line
- 175km double track
- 8.3km tunnel
- Cost €1.1 billion50 (€1.42 billion in 2020)
- LGV Bretagne-Pays de la Loire
- 214km double track
- Cost €3.3 billion (€3.71 billion in 2020)
- Includes 25 years of maintenance
- Estimated cost should be between €2.3B and €10B
- LGV Sud Europe Atlantique
- 340km double track
- €3.8 billion for the main track (€11,176,470)
- €1.2 billion for connection, signal improvements, etc.
- Nishi Kyushu Shinkansen (2022)
- 66km
- 5 stations
- $4.4B ($66m per km, or roughly €58.4m)51
- Hokkaido Shinkansen (2015)
- 148km (53km in an existing tunnel)
- 1 station rebuilt
- $4.67B ($31.5m or €27.6m)
- Hokkaido Shinkansen Extension (2031)
- 211km, 76% in existing tunnels
- 2 new stations.
- $11bn ($52M or €50.5m per km at 2022 rates)
A few clear takeaways. First off, it’s hard to estimate per km track construction vs maintenance cost for the French because of how France structures these. SNCF loves to purchase maintenance along with the track, while Japan splits them out. That being said Japanese construction costs fall slightly outside the quoted range for EU HSR construction on the high end. This is actually quite unsurprising, given the terrain of Japan and the number of tunnels their trains go through. I also listed the stations that are new with these Shinkansen extensions, but it was not clear to me if they’re included in the price. If they are included then the per-km cost of these projects drops dramatically, if they’re not then they’re still no more than 10-11% more expensive than a the worst case European HSR projects.
Secondly I’d like to draw attention to the Perpignan-Barcelona project, which is structured differently than SNCF projects. It appears that the project came in at the estimated cost of 1.1 billion euros including the tunnel which cost 300 million euros by itself. This brings the total cost of construction to an incredible 6.2 million euros per kilometer, way below the estimate. The company creating the project is going to run it for 53 years, and received a 540 million combined subsidy for its construction. To my eyes the only way this math works out is if that subsidy went entirely to constructing the route, and not to maintenance and operation, because if any is going to operation then the cost per km drops to implausibly low figures. This implies that at worst the expected operating loss is expected to be 540 million over 53 years, or 10 million per year.
Maintenance
Casey goes on a long description about how wear works on HSR, which is very interesting but not something I need to copy and paste into this post. At the end of his description about HSR wear and maintenance, he makes this claim:
Maintenance costs that were already on the order of $200,000/km/year, in 2003 dollars.
Inflation adjusted that’s $322,617.39 per year/km. I would love to know where he got that number, because I could not find it in any source Casey listed nor on my own.
What I was able to find was an analysis of European rail costs in 2009 in the Economic Analysis of High Speed Rail ni Europe, and they produce drastically different numbers than what is quoted here. The numbers I found from the 2009 paper listed a range from €12,919 to €71,650 per km total cost. I have a very hard time explaining how Italy is claiming a total maintenance cost of €12,919 per km (roughly $15,000)in 2002, while Japan is spending $200,000 per km in 2003 dollars. Yes, the Shinkansen sees more traffic than Italian HSR, but not enough to explain this difference. Rail maintenance costs scale with speed and frequency, and there is no reason to believe that HSR should cost that much to maintain in Japan. The Tokkaido Shinkansen operates 365 trains a day, compared to the 64 per day for the Florence-Rome line52. The Shinkansen is faster (277kph vs 250kph), but the it’s also heavier (715 tons vs 598 tons). They both run through mountainous terrain, and include some fairly expensive infrastructure like viaducts and tunnels. I’m not sure which is likely to cost more, but I have an extremely hard time buying the idea that Japan is spending 13x per kilometer that Italy is.
Use Jets Instead
Right, so what about Casey’s suggestion that we just use 737s instead? Where do we land on that suggestion?
This capacity could also be served by a fleet of just 40 737s (less than current LAX-SFO traffic), of which Boeing makes more than 500 per year.
Neither LAX nor SFO has the capacity to add this though. And while Boeing makes more than 500 a year, that’s because a lot of people are buying them for a lot of different routes. Realistically buying 40 planes for this route means giving up on either replacing 40 older planes with new ones, or 40 planes elsewhere in the network. There just isn’t spare capacity for that.
Bought new, this fleet would cost $3.6b, and with a lead time of, at most, a few months.
That’s not how purchasing aircraft works. There is a backlog of aircraft based on other people’s orders. Maybe you can negotiate your way up to the front of the queue, but that will definitely drive the price up.
Air Canada got its last 737 MAX 8 from its 2014 contract this August. As of September 2022 Boeing has 5,092 outstanding orders for the 737 MAX 8, and it’s deliverd 926 total. They’re hoping to get production up to get it up to 47 a month by 2023, but they’re regularly stopping and starting production due to component shortages. The A320 neo family of craft has a backlog of 6,095 aircraft, and they were delivering them at ~450 a year pre-pandemic.
Not only are you not getting either of these aircraft in a few months, you’ll be lucky to get them by the end of this decade.
Upgrades to Modesto and Bakersfield airport terminals could service the 737 for mere $10s of millions.
As we’ve seen, this is nowhere close to correct. Terminal expansions and rebuilds cost in the billions, not tens of millions. Adding a few gates to Bakersfield is probably a $1B project, minimum.
Having lived in Los Angeles previously, I also find the idea of just upgrading Bakersfield kind of funny. You do realize how far Bakersfield is from LA, right? As I’m writing this, Google Maps claims that the travel time between downtown Los Angeles and Meadows Field is 2 hours at the minimum. And anyone who’s lived in Southern California knows that you cannot assume minimum travel times when it comes to traffic, I would either leave at an insane hour or pad that trip by 30-45 minutes just to be safe. There is a damned good chance that a HSR has made it from downtown LA to downtown SF before someone else has made it from LA to the Bakersfield terminal.
Google Maps also claims similar travel times between Modesto and downtown SF. I have never been to Modesto though, so I can’t personally vouch for that.
Profitability
Japan’s ostensibly private rail companies have gone bankrupt and been bailed out so many times I’ve lost count, racking up billion dollar yearly deficits year after year.
Citation needed on the “bankrupt and bailed out so many times”. Yes, the privatization process involved the government absorbing a ton of debt, but since then they’ve been profitable. JNR was plagued with cost overruns and inefficiencies in the post-war era, and those debts did need to go somewhere. But “JNR was poorly run” and “none of the JR groups have turned a profit since then” are distinct arguments.
JR Central has increasing net incomes for the past 10 years, only going negative recently due to massive expenses constructing a new maglev shinkansen line53. And it sure as heck looks like they’re planning on paying for that maglev train without any direct subsidies. They’ve borrowed 3 trillion yen from the state, and are building the rest up in a trust fund. Maybe we can gripe about subsidized government loans, but that applies to airports and airlines too.
Indeed, as far as I know there isn’t a single HSR route anywhere on Earth that operates profitably on ticketing revenue, and so operation always requires substantial subsidies.
So, what Casey is doing here is slipping in a political argument dressed as a practical financial one. Implicit in this discussion is the assertion that rail based transit must be profitable to be good. I disagree emphatically! Railways are a natural monopoly, and a club good. I am extremely comfortable with them losing money year over year and surviving on the back of public funds. If Casey wants to argue that rail has to be profitable, he should make that argument explicitly.
Of course, the original argument is that no HSR line has ever made money, and JR central runs a lot more than just HSR. If you dig into their annual report you will see that the Shinkansen represents only 29% of JR central’s ridership, it represents 92% of the rail based revenue for JR Central. Even if we compare by passenger kilometers, the Shinkansen is 85% of the total. By passenger and by passenger kilometer, the Shinkansen makes more revenue than low speed rail.
In fact, there is no way for the Shinkansen to not be profitable, according to their report. In FY2020.3 the Shinkansen made 1,261.3 billion yen in revenue, the conventional rail made 104.2 billion yen in revenue, and the overall rail business had an operating expense of 784.9 billion yen. Even if you believe that the conventional rail was literally free, then the Shinkansen still made 476.4 billion yen, four times what conventional rail pulled in. No matter how you divvy up the maintenance budget between conventional and HSR, HSR is not only profitable but overwhelmingly so compared to regular rail. The idea that the HSR is the money loser in this company is risible.
Oh yeah, and the original Shinkansen cost … 400 billion yen! It does not take an accounting wizard to see how to make the Shinkansen turn a profit, even including debt service, upgrades, infrastructure maintenance and rolling stock upgrades over the years. Apparently it even managed to pay back the emergency World Back loan in 22 years, despite JNR being largely insolvent at that point in time.
Of course there is another question worth asking: if we hold airlines up to this standard are they profitable? Because if the issue with HSR is construction costs, then shouldn’t we consider the costs of airport construction when it comes to airline profitability too? Pick literally any airport older than 1990 and start digging through its history and it’s easy to find billions of dollars of inflation adjusted government money. And that’s before we consider the $3B in direct FAA subsidies per year towards airports, $315m a year for rural air travel the $9B cost of the TSA, and god knows how many subsidies to the airlines in terms of trade policy. Oh, and subsidies to Boeing and Airbus remain the subject of international diplomatic conflict going back decades. The exact amount is disputed, but it’s in the billions easily.
To be clear, I’m not saying that all of this is bad per se. I am personally very comfortable with government funding for things that are beneficial to the public, including very expensive infrastructure. What I am pointing out is that the standard of “profit without subsidies” is a standard that is selectively applied to rail travel and rail travel alone. That’s bullshit.
Of course roads also operate with public subsidies
This is true, but notice how we’ve subtly switched to a different standard from profit to subsidies. Casey is holding rail up to the standard of profitable, but reducing public contributions towards roads to mere “subsidy”. This is completely backwards though: most roads make no profit! None! Their construction and maintenance is paid for out of a variety of taxes, precisely because they’re a common good. As a society we recoup those costs54 via economic activity and taxes on top of them.
CA HSR
Okay, we do need to finally talk about CA HSR.
If we want to reduce CO2-generating air traffic between San Francisco and Los Angeles (a worthy goal!) then the HSR route must be, above all, fast. The oft-stated goal time of 2 hours and 40 minutes is both unachievably rapid with finite money and current technology, and also too slow to compete with aircraft
Phase 1 of this project goes from Los Angeles to San Francisco, and has a distance of 840km. Traversing this in 2 hours and 40 minutes requires an average speed of 315kph. This is quite high for HSR, but not “unacheivably rapid with finite money and current technology”. The Jinghu High Speed Railway averages 298km right now, with the goal of getting that up to a 328kph average. Even if a more pedestrian average of 300kph is managed that’s 2 hours and 48 minutes. I would not call this project a failure if it’s 2:48 when the goal was 2:40.
Meanwhile a flight from LAX to SFO is anywhere from 1hr 10min to 1hr 30 min. Getting to and through LAX in an hour is a miracle in my experience55, so plus the whatever it takes to get from SFO to your destination. Even on time alone, beating a plane on this route is not at all impossible. Heck, it doesn’t even seem that hard.
but for insane TSA security delays that will probably also affect HSR
Why are we assuming that HSR will have TSA checks? You can’t hijack a train, what function would the TSA perform? And why are we assuming that CA HSR will have TSA checks when Amtrak, regional rail systems, subway systems, and our peer nations don’t? There’s no reason we need the TSA here, we could just … not use them.
Routing HSR on the east side of the central valley via Bakersfield and Modesto means those cities can have a station, but frequent services means that most trains have to stop there, and each stop adds 20 minutes to the travel time. Alternatively, the stations and their railway corridors are extremely expensive city decorations that help no-one because the trains, dedicated to a high speed SF-LA shuttle, never stop.
It is really weird to assert that all trains will stop, or none. The obvious solution to this, and the one that most systems use is to run a mix of trains that stop at every station and only some. To pick a random example the Tōhoku Shinkansen line in Japan runs four distinct services on the same track, each with their own mix of stations that they stop at and bypass.
This obviously increases operating costs, but it would also increase ticket revenue to offset, since people won’t take HSR that doesn’t have convenient schedules. Solving this is not exactly rocket science.
To a good approximation, HSR lines have to be dead straight. In Kansas or California’s central valley, this is fine, up to a constant in Eminent Domain. But both LA and SF are ringed by a series of extremely geologically active, steep, and tall mountain ranges. The Interstate 5 out of LA goes through the Grapevine, passing through a point where 5 (5!!) different active fault lines intersect in one place. Maintaining a useful speed through these mountains, not to mention densely populated areas nearby, requires nearly 100 miles of tunnels.
I mean, one of the most prolific HSR using and building nations in the world is Japan. 100 miles is not a lot tunnels to be honest. Sure, tunnels are more expensive than over flat terrain, but let’s not pretend that they’re some insurmountable obstacle. If Japan can make 33 miles of undersea tunnel for $7B, I would hope that America could figure out tunneling through a mountain too. Also, Japan is probably more seismically active than California.
HSR also does not need to be dead straight. The TGV has grades up to 3.5%56, and curve radii anywhere between 4km (for 320kph service) and 7km for future57 speed improvements. Tilting trains are also an option here, and are commonly used for 250kph service on existing rights of way. Tilting trains of 350kph service would be new, but not revolutionary, and they should let the minimum radius for 350kph be as low as 4km.
of tunneling costs are orders of magnitude too high,
This is a political issue in America, maybe we should fix that instead of abandoning the construction of important infrastructure?
Weird Assertions
Here’s a list of weird, one off assertions that irked me. They’re not that important to my central thesis, but I just couldn’t let them go.
Ground
Hovercrafts have not caught on for the same reason as HSR – above 100 mph, the Earth is too rough to travel close to its surface.
No, they didn’t catch on because they’re about as energy hungry as airplanes are, while traveling much slower. Scroll up to the von Kármán–Gabrielli Diagram section again and check out the updated graph.
This is also intuitively obvious to pilots, who understand that making a habit of flying planes within 20 m of the surface, particularly in mountains, is a career-limiting move.
Erm, isn’t the problem less that the ground is bumpy, and more that aircraft aren’t designed to fly close to the ground all the time? This is a bit like saying that the space shuttle doesn’t fly as well as a 737; you’re evaluating a vehicle in a context wildly different from the one it was designed for.
Also, we absolutely do have vehicles that go above 100mph, it’s called High Speed Rail! They literally exist and literally go above 100mph. I feel like I’m taking crazy pills!
Los Angeles
In Los Angeles during the age of streetcars, a fire anywhere in the city would result in water hoses crossing the street from hydrant to firetruck, and then the network ground to a halt because steel wheels can’t cross a hose or surmount a temporary hump!
Perhaps this is historically true, but there are pretty easy fixes to this. You can just put in more fire hydrants, or stop a streetcar if it’s too close to a fire. Heck, you should probably do that anyways for safety reasons.
Also, the number of fires fought per year by fire fighters per year has been dropping for a while now. Part of the reason why they’re always at car crashes is because we’ve trained them as paramedics to give them something to do. I personally don’t think we should adjust the transit mechanism for an entire city soley because we’ll have to ocasionally stop one line in the case we end up having to fight a fire despite fires being drastically less common nowadays.
Building a metro system in an existing dense city is also great (if we can avoid cost disease) but for most of the cities in the US, the suburbs are already not walkable enough to enable non-vehicle transport to a neighborhood station. The suburbs of LA will never be able to depend on a Manhattan or Vienna-style underground railway.
… You were literally just talking about the streetcar network LA had previously? I don’t see why we can’t just … rebuild that. Especially since it’s not like it wasn’t popular beforehand, it was purchased and sabotaged by car companies on purpose.
Japan
Add to that various Japanese prohibitions on certain weapons technology in the post war period and high speed rail served as a government imposed solution to mass transportation.
It’s a minor thing, but trains are critical military infrastructure, we’ve just forgot that. JNR was literally taken over by the Japanese military during WW2. The US nationalized the rail roads in WW1. The US army still has a MOS for driving a train, 88U.
Even if you’re an island nation, the ability to move people around quickly and cheaply has obvious military implications.
Japan and much of China is relatively mountainous, historically relatively poor, and historically beset by relatively poor transport networks.
… But I thought the argument was that HSR is too expensive and doesn’t work wherever the earth isn’t that flat? You can’t have it both ways here, either it’s inherently expensive, or it’s the choice of poor countries that can’t afford a lot of air and car travel. It can’t be both.
Road Cost
For example, the I-70 cost an average of about $2m/mile, despite routing through remote and mountainous parts of Utah
No way. Here are three major pieces of infrastructure along that road, inflation adjusted to 2020 dollars.
- Eisenhower tunnel bore: $490m
- Johnson tunnel bore: $384m
- Glenwood Canyon: $828 m
- San Rafael Swell: $1.3B
These sum up to $3B, which leaves a measily $1B for the rest of the highway, or an impossible $450K per mile. These must be 1950 dollars.
A 2011 memorandum on the West Davis corridor project estimated $8M per mile of new four lane highway, $10M per five lane arterial, and $19M per interchange. Florida DOT estimates that a new 4 lane divided interstate costs $6M a mile in rural areas, and $13M in urban areas. And Florida doesn’t really have mountains. No way you’re getting a highway through that kind of terrain for $2M a mile in 2020 dollars.
People drastically underestimate how much roads cost.
Cost Overrun
The vast majority of this is unfunded, and yet the final project will almost certainly cost at least 10x this if it ever completed
I agree that this project is overly expensive, but now you’re just making numbers up.
Conclusions
Train good. Faster train better.
The first draft said “ealier today”. That was an optimistic assumption on my part about how long this would take to write. ↩︎
With some very basic back of the envelope estimates, track construction should cost anywhere between $8.4B and $37B based on historical estimates of European HSR construction, with another few billion for stations and rolling stock. Instead it’s going to cost $113B, or about three times too much. ↩︎
There is no way this post can be considered “concise” ↩︎
Even using inflation alone is somewhat suspect. Inflation generally measures the change in price for a “basket of goods” that end users are price sensitive for. Milk, meat, housing, gasoline, etc. While a lot of this does affect construction costs (workers need to afford food and housing, etc.), they are not directly linear. Similarly steel costs do not directly affect consume good prices, but indirectly. None of this also accounts for improvements in productivity. Just because something cost $X dollars in 1950 does not mean it’ll cost $X inflation adjusted now if we’re using more efficient machines and techniques. But we’ve gotta do something to compare numbers, and I don’t see a better tool available. ↩︎
This is probably a partial explanation for why China has built so much HSR. ↩︎
Personally I think the EU’s definition structure makes sense, although I would fiddle with the numbers a bit. I think that defining HSR as only being above 250kph/155mph leaves us with the rather unsatisfying situation of considering both a 125mph interurban and a 60mph urban metro as being equivalently slow. I would’ve made Category I the slowest, and Category III the fastest, which makes adding Categories IV and V trivial if we make faster rail one day. I don’t think categorizing a 250kph TGV and the 431khp Shanghai maglev as both being equally “Category I” feels correct. ↩︎
They also define “very high speed rail” as peaking over 250kph and averaging 200kph. ↩︎
Indeed, once we define HSR as 250kph and above we end up with 21 countries with operating service, 9 actively building or upgrading lines, 8 planning, and another 3 with plans that are currently on hold. ↩︎
Airports are fundamentally a nuisance, so there are practical, political limits on where they can be placed. In all but one of the cities I’ve lived in it took an average of an hour or more to get from my house to the airport door. The worst was LAX, by far. Generally the smaller the airport the better, but alas these also represent a proportionally small percentage of travel miles. ↩︎
Some of these could be improved, but my suspicion is that most are inherent. Nothing is going to move LAX to a more convenient location, and there are several profit-motivated actors involved that want to minimize these delays so that they can sell more tickets and move more people with the same infrastructure spend. If Southwest cannot get the turnaround time down further, then there is probably very little room for improvement. ↩︎
Which comes out to 150mph. Presumably if America used metric they would’ve gone with 250kph, since people do love nice round numbers. ↩︎
This is not a typo. ↩︎
Also, methane isn’t jet fuel. ↩︎
Personally I think that if you’re creating methane from atmospheric carbon, the best thing you can possibly do is bury it rather than burning it again and potentially leaking some. Methane has a warming potential about 80X of CO2 over the first 20 years, so if you leak more than 1/80th (1.25%) of the produce methane, you’re actually making the situation worse. Leaking methane from power and home heating is actually a big issue, we should do something about that. ↩︎
JR Central claims that the Shinkansen beats air travel for the same route by a factor of 1:8 per MJ and 1:12 for CO2 per seat. If we adjust for the non-CO2 warming of jet travel it’s 1:24 or higher. Even using synthetic fuels captured from atmospheric carbon doesn’t move the ratio beyond 1:12. ↩︎
God, I love the metric system. ↩︎
Especially since the alternative more often than not is just highways. ↩︎
The TGV Duplex highlights the flexibility of rolling stock design, because it uses a mix of refurbished TGV Réseau carriages and Euroduplex carriages. ↩︎
Maximum theoretical configuration. This train is not yet in operation. The TGV M features a modular interior, and is designed to run with anywhere between 7 and 9 carriages. Most will be smaller than this. ↩︎
I do not have 2019 numbers available, but 2018 was smaller than 2021 in terms of total passengers, so I think this number is safe to use. ↩︎
The minimum safe headway of a rail system is determined by signal design, driver reaction speed, and vehicle braking performance. This is part of the rationale for a maglev train, which can accelerate at higher speeds and therefore can reduce the minimum safe headway and travel time. The L0 maglev train should take a bit under 4 minutes to hit 603 kph, while the N700S takes 3 minutes to hit 270kph. ↩︎
Then again, I’m writing this note at 3:42AM for largely similar reasons. ↩︎
The original paper did not make it clear what kind of train it was, but given the very low max speed I suspect it’s steam. ↩︎
The lifecycle for HSR appears to be about 25 to 30 years for high speed service. Sometimes older models are refurbished and reused for slower or less important routes. ↩︎
This implies that driving by road might be more energy efficient once a car has two to three people in it, which seemed counterintuitive to me. The Sierra Club had a Q&A about this and seem to largely agree with this assertion though. They also then argued for hitch-hiking, because you know, it’s the Sierra club. ↩︎
Since 2009 several narrow body jets have converted to the more efficient CFM Leap engine, including the A320-neo and the infamous 737 MAX series. Airbus claims 15-20% lower full burn for the A320-neo, and Boeing claims 14% less than the previous 737NG. Applying these numbers gets us anywhere between 1.44 and 1.53. ↩︎
Personally I think “free” is the wrong way to view the interaction between authors and their readers. Both of us are writing blogs to persuade people and convince our readers that we’re smart people who have good ideas; we both get something out of this, even if it’s not money.. I think that part of this interaction is that authors should try and exercise diligence when writing, and correct honest mistakes when they’re pointed out. We owe our readers some level of rigor even they’re not paying us. ↩︎
There exist one maglev train in operation, and one seriously being constructed. The one in use is a relatively short line between Shanghai and its airport. Cool, but not that impactful. The interesting one is the Chūō Shinkansen, which is being built. JR Central is spending a gobsmacking amount of money on this, and I have no clue why, since to my amateur eye I don’t think regular HSR wouldn’t work. But it’s not my money, and I personally really love the “dudes rock” energy they’re showing here. ↩︎
The correct number seems to be 19,920, although the data on the smallest airports appears to be kind of sketchy. I am assuming his number is old, but this correction strengthens his argument. ↩︎
This excludes commercial pilots. I feel like including them is a bit like including train operators or taxi drivers in this analysis: their means of transit is drastically affected by their chosen vocation to the point where it’s not representative of the general population. Also, there is no guarantee that commercial pilots own their own planes for use in general aviation airports. ↩︎
Casey has indicated that he is a pilot, so he has access to all these airports. Which, good for him! More than once I’ve dreamed about getting my own license and plane, and I’m sure it’s nice to hop in your plane and travel without having to deal with traffic and what not. But the percentage of the US population who can reasonably do this is so small, I do not think it’s fair or reasonable to include it in a comparison between HSR and air travel. ↩︎
In general I think it’s a mistake to compare private owner-operated general aircraft to mass transit, because these planes are really more about enjoyment than practical transit. You buy and operate a plane because you like flying, not because it’s necessarily an efficient way to get around. Owning a plane involves a lot of fixed costs, and you have to fly a lot of hours before the per hour cost gets under control. But since this is about comparing things, I do feel compelled to point out that these planes are pretty danged slow compared to scheduled air service or HSR. There are indeed general avitaion planes that can outrun HSR, like the Mooney M20 (278 mph cruise) or the Cirrus SR22 (211mph), but the vast majority of private planes are going to be your used Cessna 172s and Piper Cherokees, both of which top out around 140mph. ↩︎
According to the Bureau of Traffic Statistics, in July of 2022 there were 467,000 non-scheduled flights, and 80,360,000 scheduled flights. Similarly over the 12 months ending in July of 2022 there were 4,421,000 non-scheduled flights and 808,627,000 scheduled flights. So non-scheduled flights represent 0.56% of overall flights. Revenue passenger miles show similar proportions. This is such a tiny percentage I feel ok in ignoring this type of flight and the airports that only serve it from our analysis. ↩︎
It also brings my personal travel record up to anywhere between 4-15% depending on whether on whether we’re including nonhub and reliever airports or not. This feels much more intuitively correct. ↩︎
Communication tools like email and social media tend to show strong network effects. ↩︎
Factorial, not a generic explanation mark. ↩︎
This is precisely the case I made at the beginning of this article. Not every pair of cities makes sense to connect via HSR. Your basic passenger train could trivially outrun cars on this route, and even with stops in between. The MPI MPXpress used by the Chicago Metra maxes out at 102 mph, and could do an express run in about half as long as a car can. Oh, and it was made in Boise, the irony. ↩︎
The effective result of not having even regular speed rail offerings in the US is that a lot of trips get shifted from mass transit to individual vehicles. This has a lot of downsides that are not immediately obvious, including increased road deaths and health costs associated with road air pollution. While we will never be able to get these numbers down to zero, there is an argument that creating transit options that reduce car miles travelled would pay for itself in the reduced externalities of excess road miles. But that’s the subject for another post. ↩︎
The one offered by the defunct B&O, not the Amtrak line of the same name. Amtrak does not offer the branch service to Youngstown. ↩︎
Consider how small Charles De Gaulle airport is, for example. It’s only the 31st busiest airport in 2021, despite it serving the largest metro in Europe and being one of the most visitied cities in the world. And sure, you expect cities like Delhi Beijing to be busier, but what’s shocking is how many American airports are busier. Charlotte North Carolina saw 20 million more passengers than Charles De Gaulle did. Oh, and CDG was unbelievably cheap to construct, too. Inflation adjusted it only cost $1.4B. Denver International Airport cost 6x as much, and it was made in an empty field outside of Denver rather than in Europe’s biggest city. ↩︎
It’s also possible that shifting some road traffic over to HSR will cause new road traffic to be generated to maintain the traffic equibrium. This does not reduce externalities, but it does mean that more economic activity is happening for the exact same road network. So this is good, but not as good as I first stated. C’est la vie. ↩︎
This largely works because the really big cost for HSR is the tracks itself. The trainsets are quite cheap. France’s new 740 seat TGV M cost €2.7 billion for the first 100 sets, or a mere €27 million per trainset. The 1,323 seat N700A cost $591.5 million back in 2014, or about $37m per train, and will soon be automated for lower operating cost. ↩︎
Americans seem to be politically squeamish about direct subsidies for a lot of things, but the military is a great way to sneak a subsidy in without issue. Heck, the law creating our highway system was the “National Interstate and Defense Highways Act (1956)”. ↩︎
The bond is very clear about it not being general revenue funds, and in the case where revenue does not cover the bond repayment the tax payers are protected. But this also seems to prevent any surplus revenues from ever reaching the general fund where they can be spent by the city. The document says that “At the discretion of the City, all or a portion of the remaining Revenues may be deposited to the Surplus Fund to be used for any lawful Airport System purpose.”, which is effectively locking tax and fee revenue away from future city use. ↩︎
Cost overruns like this are regularly a point against HSR and other rail transit projects, but they’re also super common in road and airplane projects as well. Personally the fact that only some of these get called out irks me. ↩︎
Lol, Chicago, what are you doing? ↩︎
Part of a $15B project to modernize LAX before the olympics. Necessary, because LAX is awful, but holy crap it’s expensive. ↩︎
This is a US military base. ↩︎
This is the total cost, not the subsidy. The actual subsidy was €540m split between the EU, France, and Spain. ↩︎
Using the year wide average of 0.877 USD/EUR ↩︎
Newer lines exist, and ridership has been up drastically for Italian HSR since then, but these cannot be reflected in the maintenance costs from 2002, so I am excluding them. ↩︎
And due to Covid. But airlines needed a massive bailout there too, not the fault of either of them. ↩︎
But not always. High road maintenance costs are a decent chunk of what finishes off shrinking towns, as the reduced economic activity and road maintenance budget create a positive feedback loop. Strong Towns has a lot of info on this, with their argument being that we need to be more careful about road construction and its long term costs. ↩︎
Sitting in my car for 45 minutes in a queue of traffic on Lincoln Ave to get into the airport entrance is seared into my memory indelibly. Getting to, through, and from LAX airport was always among the worst flying experiences possible. Oh, and the coffee in Terminal 1 sucked. ↩︎
One of the great advantages of electrified trains is that you get potential energy back under regenerative braking. The issue with steep grades is the amount of energy required to maintain any given speed, but most HSR trainsets are capable of higher outputs for short periods of time. So steep grades can be okay for short bursts. ↩︎
The math on train minimum radii indicates that this should be for 400kph service. ↩︎